Knowing that content played is not the same as knowing whether it worked. Measuring content effectiveness means connecting what displayed on screen to a measurable outcome — attention, engagement, or action — so decisions about future content are based on evidence rather than guesswork.
Foundational Layer: Proof of Play
Every effectiveness measurement starts with an accurate record of what actually ran, when, and where. Proof-of-play data establishes the baseline: without it, you can't reliably attribute any downstream metric to a specific piece of content.
Attention and Engagement Metrics
Once you know what played, the next layer measures whether anyone noticed:
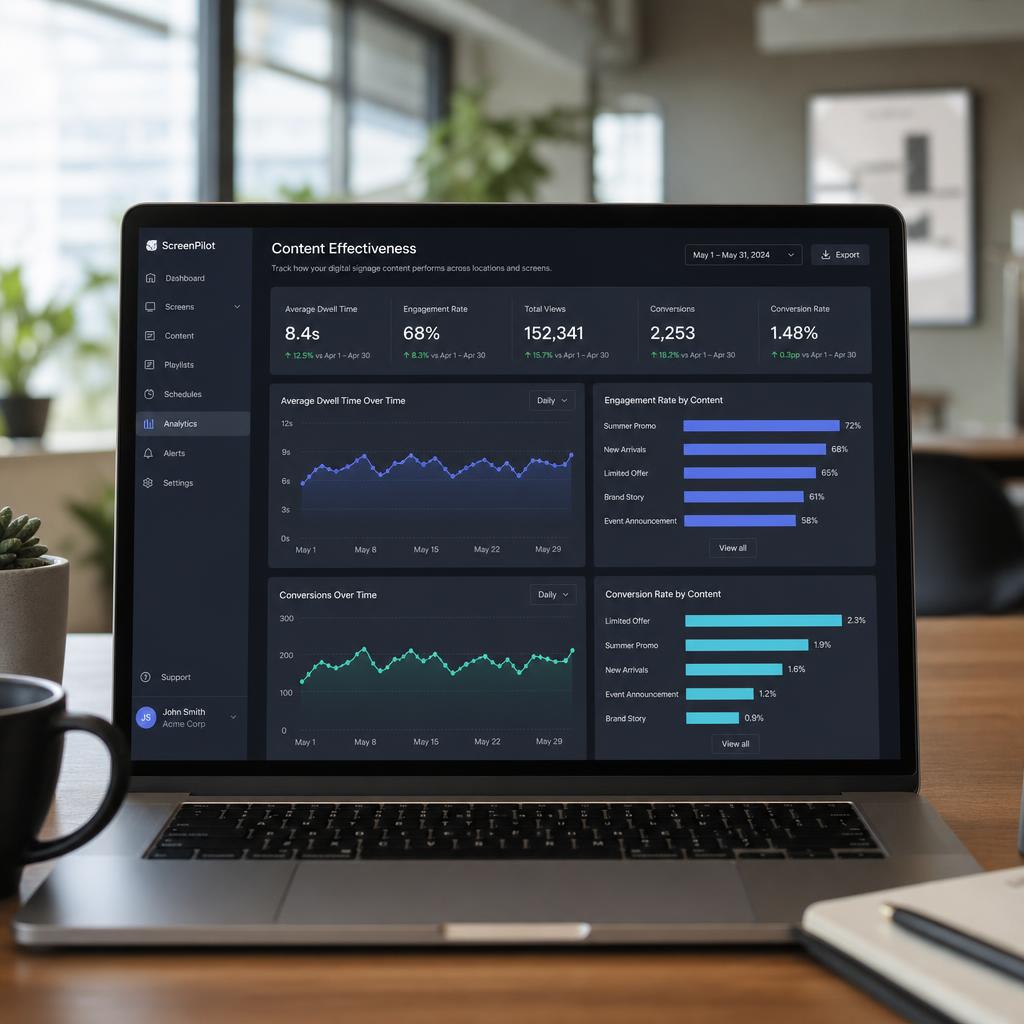
- Dwell time: How long people spend near or looking at a display, often captured through anonymous camera-based sensors or Wi-Fi/Bluetooth presence detection.
- Impressions: Estimated audience count based on foot traffic or sensor data during a content window.
- Interaction rate: For touch or gesture-enabled displays, the percentage of nearby viewers who actively engage.
- Attention duration: How long a viewer's gaze or presence is sustained once they stop near a screen, indicating whether content held interest.
Outcome and Conversion Metrics
The strongest effectiveness signals tie content directly to a business result:
- Redemption tracking: Coupon codes or QR codes unique to a specific piece of content, so redemptions can be attributed back to it.
- Point-of-sale correlation: Comparing sales of a promoted item during and after a content window against baseline sales.
- Traffic lift: Comparing foot traffic in a zone before and after content changes.
- Digital conversion: For QR-code or NFC-driven content, tracking scans and subsequent web or app actions.
Comparative Testing
Effectiveness is most meaningful in comparison:
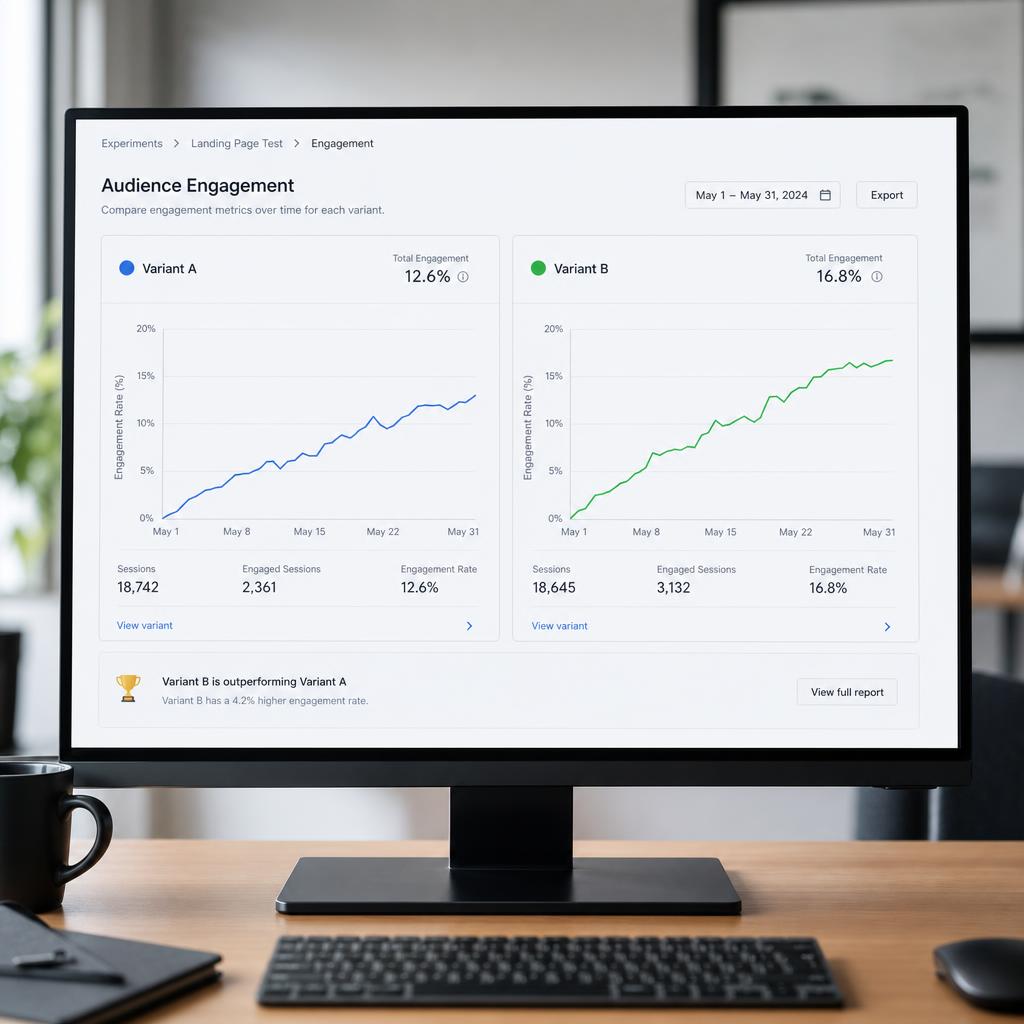
- A/B testing: Running two content variants across similar locations or time windows and comparing outcomes.
- Daypart comparison: Evaluating how the same content performs at different times of day.
- Location comparison: Testing whether content that performs well in one location translates to others.
Building a Measurement Practice
- Start with reliable proof-of-play data as the foundation for any comparison.
- Add at least one engagement signal (dwell time or interaction rate) relevant to your display type.
- Where possible, connect content to a concrete outcome metric (sales, redemptions, or conversions).
- Test one variable at a time — content, timing, or placement — to isolate what's actually driving results.
- Review data on a regular cadence and feed findings back into scheduling decisions.
SPARC's Measurement Tools
SPARC combines proof-of-play logging with exportable analytics data and API access, so effectiveness metrics from third-party sensors, POS systems, or attribution platforms can be layered on top of accurate playback records for a complete picture of content performance.