Digital signage analytics turn a network of displays from a set of passive screens into a source of measurable business data. Rather than just confirming content is playing, analytics answer questions about who saw it, how the system performed, and what worked.
Categories of Digital Signage Analytics
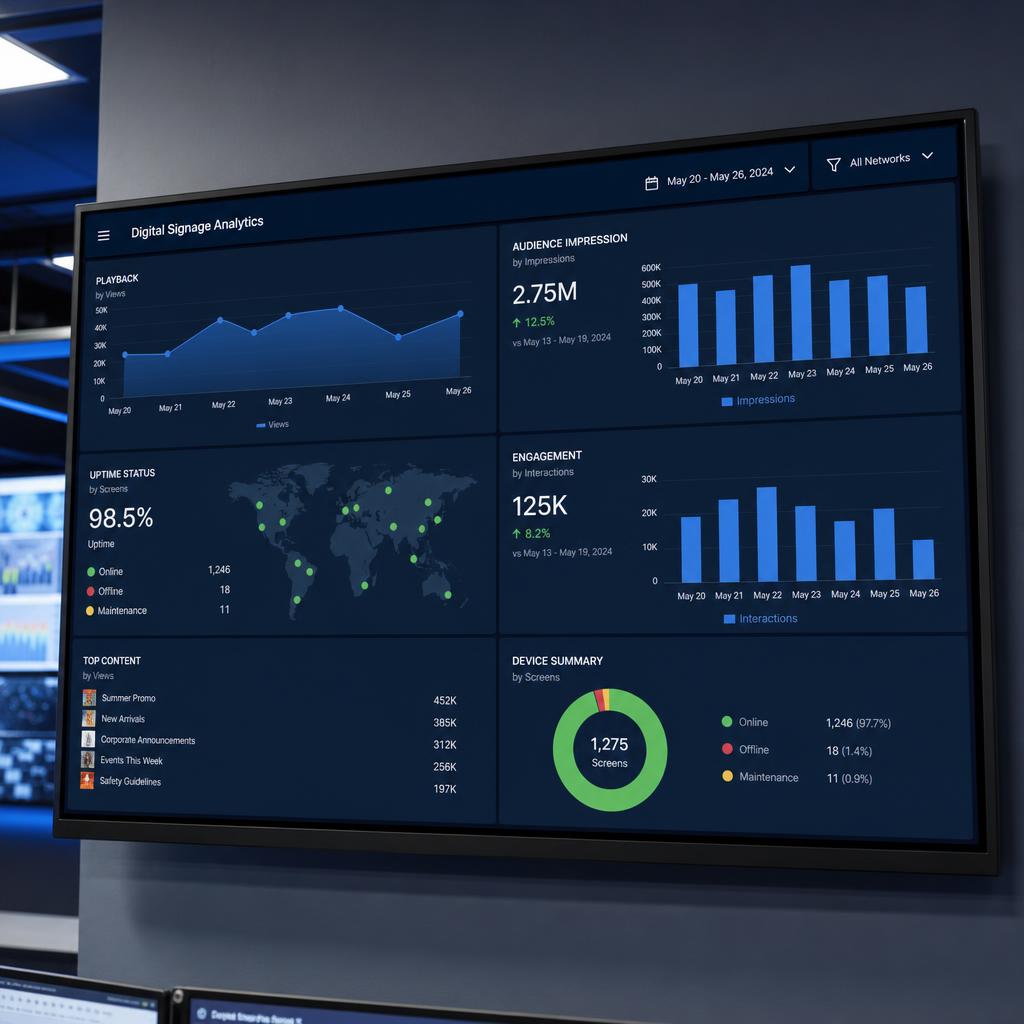
Playback Analytics The foundational layer: what content played, when, for how long, and on which displays. This is the proof-of-play record that underlies most other reporting.
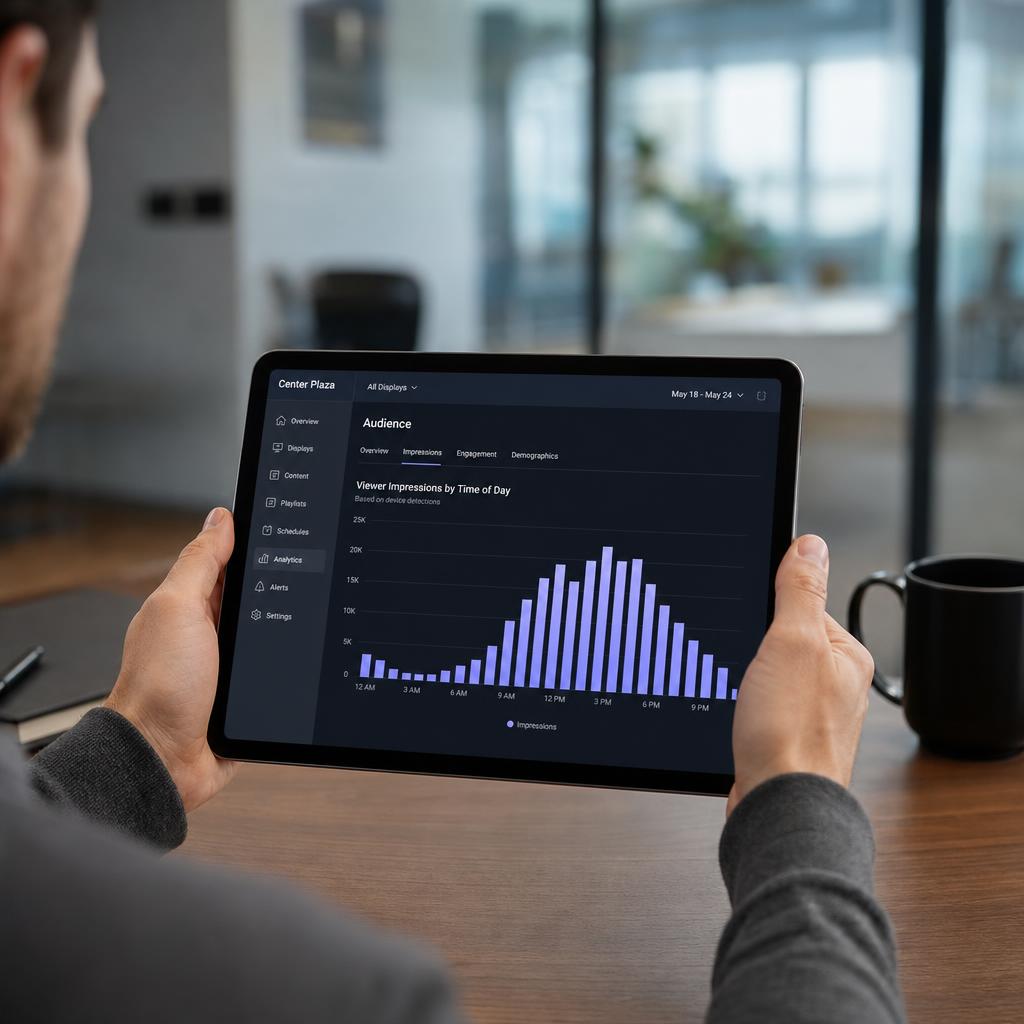
Audience Analytics Data about who was in front of the screen, typically gathered anonymously through camera-based sensors or presence-detection hardware: - Estimated viewer counts (impressions) - Dwell time and attention duration - Anonymized demographic estimates (age range, gender) where sensors support it - Traffic patterns by time of day and day of week
Engagement Analytics For interactive displays, tracking how people engage with the content itself: touch interactions, screen navigation paths, QR code scans, and completion rates for interactive experiences.
System Performance Analytics Operational health data across the display network: - Uptime and connectivity by display or location - Player and hardware health (temperature, storage, errors) - Content delivery success rates - Alert history and resolution time
Business Outcome Analytics Where signage analytics connect to broader business systems: sales correlation, redemption tracking, and traffic lift analysis that ties content performance to revenue.
Why These Matter Together
Any single analytics category tells only part of the story. High impressions with low dwell time might mean content isn't holding attention. Strong engagement with poor uptime in a specific location might mean a hardware issue is masking otherwise-good content. Combining playback, audience, engagement, and system data gives a much more accurate picture than any one metric alone.
Using Analytics to Improve Signage Performance
- Establish a regular reporting cadence (weekly or monthly) rather than only checking data reactively.
- Compare performance across locations and dayparts to spot patterns.
- Use system performance data to catch operational issues before they affect content delivery.
- Feed audience and engagement findings back into content and scheduling decisions.
Privacy Considerations
Audience analytics based on cameras or sensors should be implemented with privacy in mind — most systems process video locally and output only anonymized, aggregated counts rather than storing identifiable images, and any deployment should follow applicable local privacy regulations.
SPARC's Analytics Capabilities
SPARC centralizes playback and system performance analytics in its dashboard and provides API access for integrating third-party audience-measurement and POS data, giving a unified view of how the entire display network is performing.