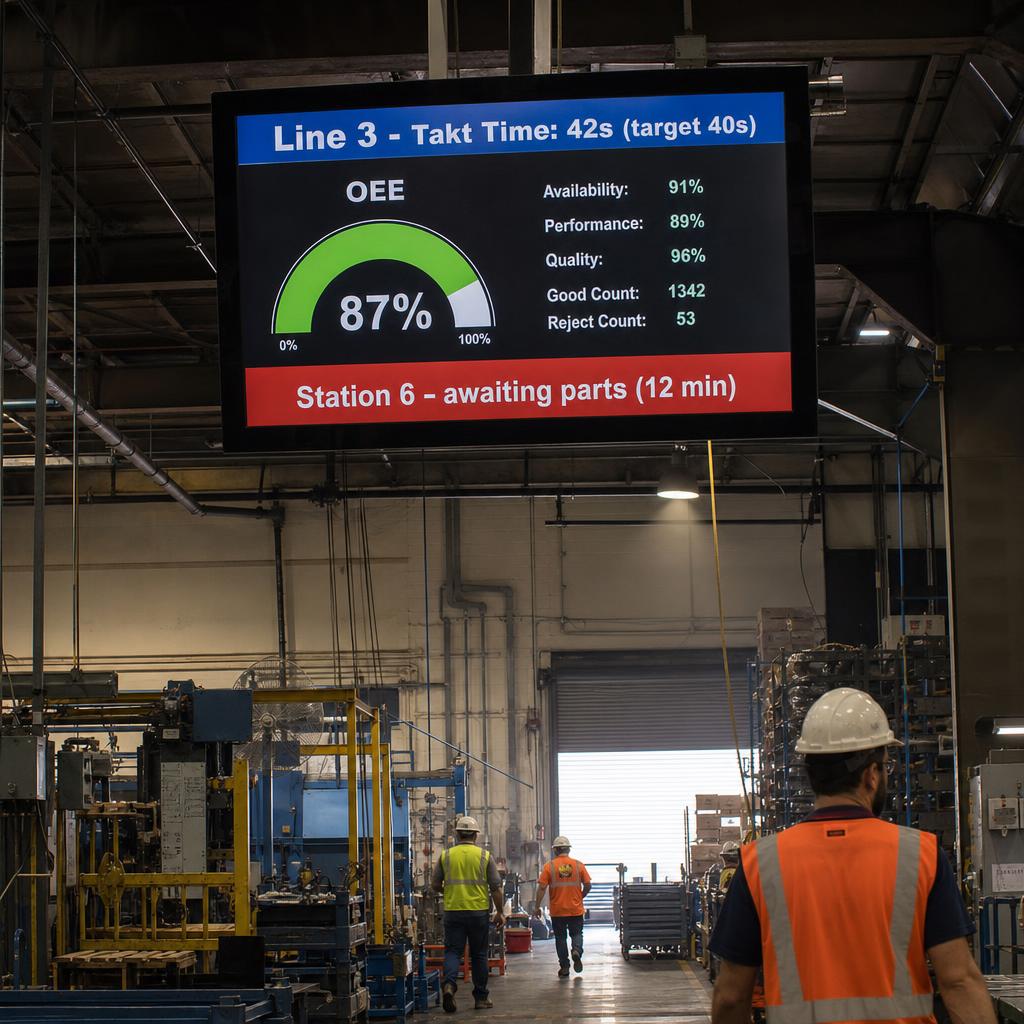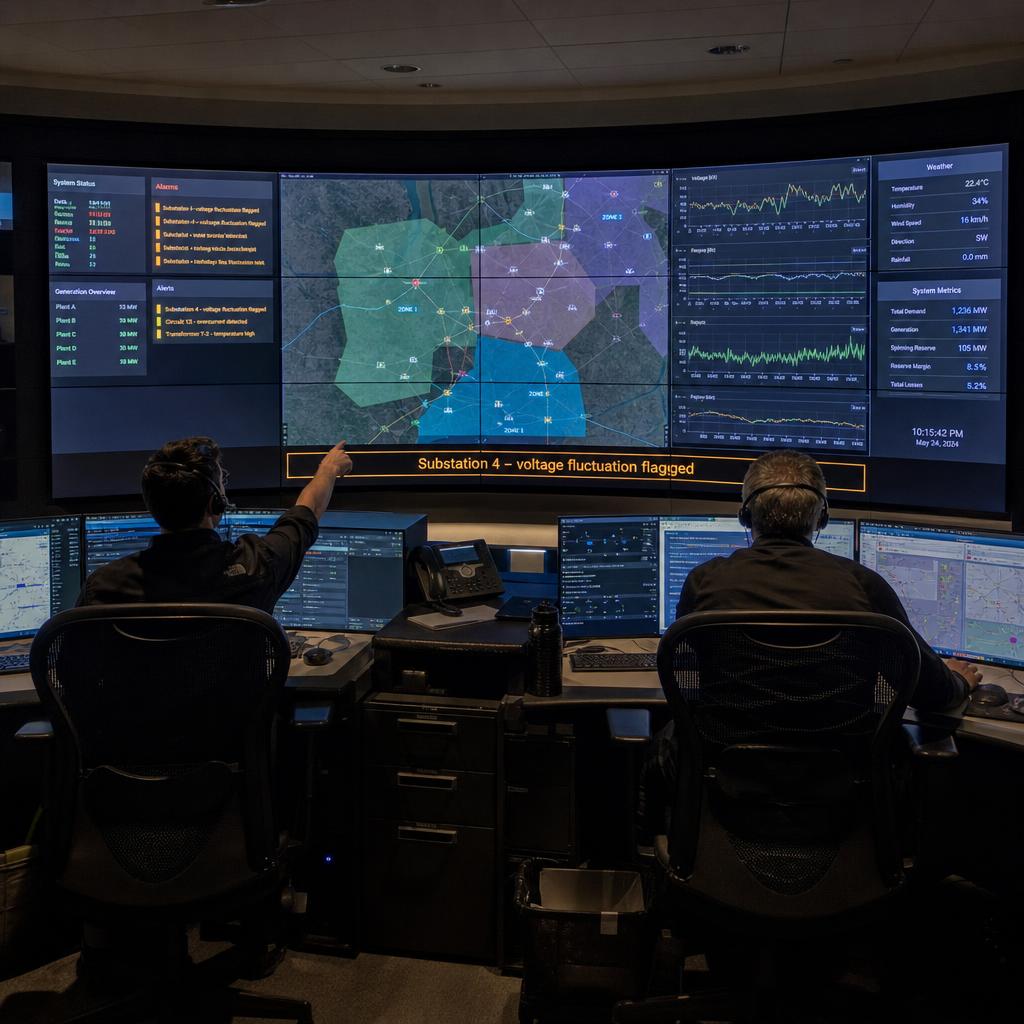
What Is a Control Room Dashboard Display?
A large-format screen or video wall that pulls data from a utility's existing systems and renders it as one visual layout for the operations team.
It draws from:
- SCADA historians
- GIS mapping platforms
- Alarm and notification feeds
It is a display and visualisation layer, not a control system. It does not replace SCADA, historians or alarm management software. It sits alongside them, showing a consolidated picture of information that already lives inside certified operational technology systems — so situational awareness does not depend on switching between five workstation screens.
For critical infrastructure operators, that distinction is the whole point.
- The display gives the team a shared visual reference for asset status, network maps and active alarms
- Any actual monitoring, control action or safety-critical decision still runs through the certified SCADA, DCS or EMS environment it draws from
Treating the wall as anything more than a presentation layer creates a compliance problem and a false sense of security at the same time.
Where Does the Display Layer Sit in the Stack?
It helps to be explicit about the architecture before getting into integration detail. A typical control room stack has three layers:
- The OT layer — SCADA masters, RTUs, PLCs, and historians that actually poll field devices, execute control logic, and log process data under whatever certification and change-control regime the utility operates under.
- The IT/data layer — historian export services, GIS servers, alarm and notification platforms, and often a data diode or one-way gateway that moves read-only data out of the OT environment into a corporate or DMZ network segment.
- The display layer — the signage or video wall platform, which reads from the IT/data layer (never directly from OT) and composes what operators see on the wall.
SPARC operates entirely in that third layer:
- Consumes data through APIs, file exports or message queues IT has already sanctioned for external consumption
- Has no write-back path into SCADA or field devices
That one-directional flow is what keeps the display layer from becoming an OT security or certification concern. It is the model most utility cybersecurity frameworks expect from anything sitting outside the control network boundary.
What Does Each Data Feed Contribute?
A control room video wall is rarely fed by a single source. It's usually a composite of several feeds, each contributing a different kind of situational context. The table below outlines the integration types most commonly seen in utility deployments and what each one typically adds to the display.
| Data Source | Typical Integration Method | What It Contributes to the Display |
|---|---|---|
| SCADA historian | REST API or scheduled export (CSV/OPC-UA gateway) | Trend charts, tag values, and asset status pulled from historised process data |
| GIS / network mapping | Web map service (WMS/WMTS) or GIS vendor API | Live network maps, asset locations, service area overlays |
| Alarm & notification systems | Webhook, message queue, or API polling | Active alarm counts, severity banners, escalation status |
| Weather & environmental feeds | Third-party API (BOM, private provider) | Rainfall, temperature, and event overlays for context on network load |
| CCTV / site cameras | RTSP/NVR integration | Live camera tiles for depot, treatment plant, or substation visual checks |
| Business systems (CMMS, outage management) | API or database view | Work order counts, outage tickets, crew status panels |
Every one is pulled in as read data. None gives the platform a path to issue commands back into the source system.
That boundary is what keeps the display honest as a visualisation tool rather than a control interface.
For how these integration patterns work outside the utility context, see our guide to digital signage API integrations.
How Should the Wall Be Composed?
Rarely with one data source filling the whole thing. The common pattern is zoned:
- A network map across several tiles in the centre
- A scrolling alarm ticker along the bottom
- SCADA trend widgets in a side column
- A rotating panel of site cameras or KPI tiles in a corner
This is a layout composition problem as much as an integration one.
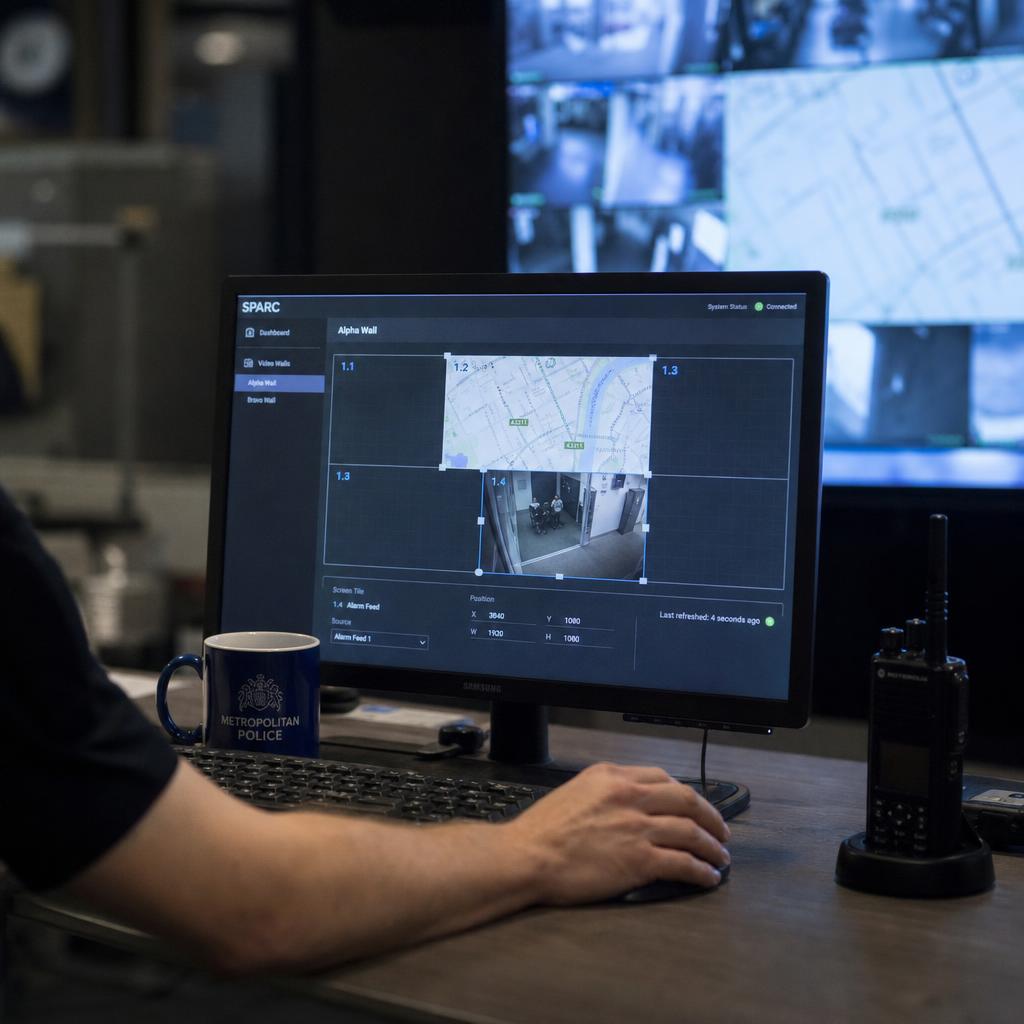
A platform built for this lets an operations or IT team define independent zones on a single canvas, or across a multi-screen video wall, and assign each zone its own data source, refresh interval and fallback behaviour.
The cadences genuinely differ:
- A GIS map — refreshes every few minutes
- An alarm feed — near real time
- A KPI tile — might change once a shift
Zoning and refresh cadence matter more for usability than visual polish. Operators scan the wall peripherally for most of a shift, and a layout that buries the alarm zone among slower-moving tiles undermines the point of having a wall at all.
SPARC's hardware control tools handle this at the device level, so one video wall can be split, zoned and independently addressed without a separate player per source.
Uptime, Redundancy and Failover for 24/7 Display Operations
Control rooms typically run continuously, and an operations manager evaluating a display platform will reasonably ask what happens when a screen, a player, or a network link drops out mid-shift. A few practical expectations are worth setting:
- Local caching. The display player should hold the last known good state locally so a brief loss of connectivity to a data source shows stale-but-labelled data rather than a blank screen.
- Player-level redundancy. For genuinely critical walls, a secondary player or content source configured to take over on failure reduces the chance of a single point of failure taking the whole wall dark.
- Clear staleness indicators. Any dashboard pulling from external systems should visibly timestamp or flag when data was last refreshed, so operators can tell the difference between "quiet network" and "feed has stopped updating." This matters more in a control room than almost any other signage use case — a stale alarm panel that still looks live is worse than no panel at all.
- Monitoring the display layer itself. The platform should expose its own health and connectivity status (ideally to the same monitoring tooling IT already uses) so a dropped feed or offline player gets flagged the same way any other IT asset would.
None of this replaces the redundancy already built into the certified SCADA environment — that's a separate, more rigorous discipline with its own standards. What it does is stop the display layer from becoming the weak link that undermines confidence in data that is, at the source, perfectly reliable.
Security and Network Segmentation Considerations
Because a control room dashboard sits adjacent to OT infrastructure, network segmentation deserves its own mention rather than being folded into "uptime."
The working principle most utilities apply — three rules:
- Read only from a DMZ or corporate-side data layer
- Never reach directly into the OT/SCADA network
- Never be granted write-back capability into a historian, GIS server or alarm system
Where a data diode or one-way gateway is already part of the architecture, the signage platform's integration sits entirely on the outward-facing side of it.
It's also worth treating the display player hardware itself as a managed IT asset — patched, on a monitored network segment, and covered by the same access controls as any other screen showing operational information in a shared space. None of this is signage-specific; it's the same segmentation discipline that applies to any dashboard, kiosk, or reporting tool that touches utility data.
Deployment Considerations: Hardware, Latency and Refresh Rates
A few practical factors shape how a control room video wall deployment differs from a typical corporate or retail signage rollout:
- Viewing distance and resolution. Control room walls are often viewed from several metres away by multiple operators at once, so tile sizing, font scaling, and colour contrast need to hold up at distance, not just look good in a close-up demo.
- Refresh cadence versus network load. Polling a historian or GIS service too aggressively can put unnecessary load on systems IT would rather protect. Matching refresh intervals to how quickly each data type actually changes (seconds for alarms, minutes for trend data, longer for maps) keeps the integration considerate of the source systems.
- Colour and alert conventions. Where a dashboard surfaces alarm states, colour conventions should align with what operators already use on their SCADA HMI screens, rather than introducing a second colour language for the same information.
- Player hardware sizing. Multi-zone, multi-source layouts with live video tiles are more demanding than a single rotating image slideshow, and hardware should be sized for the actual number of concurrent feeds and zones, not just screen count.
These are the same fundamentals covered in more general terms in our piece on real-time screen control, applied here to the specific demands of a 24/7 operations environment.
Getting Started: A Practical Implementation Path
Most utility deployments follow the same four steps:
- Confirm with IT and OT which data sources are already exposed for external consumption — or scope the work to expose them safely
- Define the zones and layout the operations team actually wants on the wall
- Pilot on a single screen or small wall segment before committing to a full room
- Build staleness and redundancy handling in from day one, rather than retrofitting it
Involve control room staff and the IT/OT security team early. The most common delay is discovering a network segmentation objection after hardware has already been ordered.
If you're scoping a control room or operations centre display project, book a demo and we'll walk through how SPARC's zoning, multi-source layout, and hardware control tools apply to your specific mix of SCADA, GIS, and alarm data sources.
Control room display FAQs
Does a control room dashboard display replace our SCADA system?
No. A dashboard display is a visualisation layer that reads data from SCADA historians, GIS platforms, and alarm systems and presents it visually. It has no control authority over field devices and doesn't replace the certified SCADA, DCS, or EMS system it draws from. Actual monitoring and control decisions continue to run through those certified systems.
Can the display platform write commands back into SCADA or GIS systems?
No, and it shouldn't be architected to. A properly scoped control room display integration is read-only: it pulls data out through APIs, exports, or one-way gateways and has no write-back path into OT systems. This is a security and certification boundary, not just a technical preference.
How is this different from a general API integration for signage?
The underlying integration mechanics, APIs, webhooks, scheduled exports, are similar to any enterprise signage deployment. What's different in a control room is the network segmentation requirements, the need for staleness indicators on time-sensitive data, and the layout demands of composing several live feeds into one legible wall.
What happens if a data source goes offline?
The display should fall back to the last cached state and clearly flag that the data is no longer live, rather than freezing silently or showing a blank tile. This staleness indication is one of the more important requirements for control room use, since a dashboard that looks live but isn't is more misleading than one that visibly isn't updating.
Do we need a dedicated video wall, or can this run on individual monitors?
Either works. Some control rooms run a single large video wall split into zones; others run several independent monitors, each dedicated to one data source or function. The layout and zoning approach is the same in both cases — it's a question of physical space and operator preference rather than a platform limitation.
How often should each data feed refresh?
It depends on the source. Alarm feeds typically need near-real-time updates; SCADA trend data is often meaningful on a scale of seconds to minutes; GIS maps and KPI panels can usually refresh far less frequently. Matching refresh intervals to how fast each data type actually changes avoids putting unnecessary polling load on source systems.
Who should be involved in scoping a control room display project?
At minimum, the operations team who will use the wall day to day, the IT team managing network segmentation and data exposure, and whoever owns the OT/SCADA environment the data originates from. Getting all three involved early avoids the most common delay: a security or segmentation objection surfacing after hardware has already been purchased.